
2019 has been a good year for most investors. Stocks and housing prices are at all-time highs, the economic expansion and jobs growth are both the longest in history, and the unemployment rate sits at a 50-year low (3.5%). Even still, there are always uncertainties. Some questions that I have heard a lot this year:
“Should we prepare for a recession?”
“When do you think the market is going to pull back?”
“Should I invest now?”
These are valid questions for a number of reasons. The current economic expansion in the US is the longest on record. Overall economic growth in the US and the World has weakened over the last year. Interest rates around the world have fallen. We have been in a trade war. Political uncertainty is in the news daily.
Yes, economic growth is slower, but it is still present. You can see in the chart below that the current economic expansion is the longest at 123 months through 9/30/19, now 125 months. However, it has also been the weakest expansion historically (see the light blue line in the 2nd chart below for the expansion starting 4th quarter 2007) from a growth standpoint. Does that justify the length? It is possible.
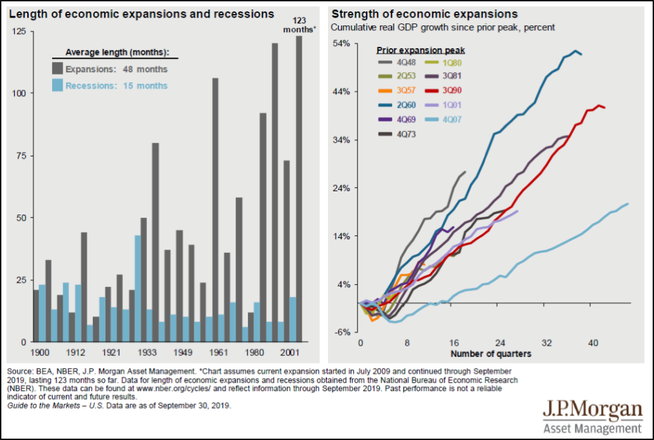
Interest rates have fallen around the world but seem to be stabilized for the moment. Lower interest rates encourage more investment to achieve a higher return. The trade war and political uncertainty are day-to-day but indications point to agreements in phases as we approach the 2020 election cycle.
My answer many times over to these questions is that there will always be a wall of worry surrounding the economy and markets. We cannot predict the future. We are long-term investors. There are many so-called market gurus and smart people who made moves earlier this year in anticipation of a market downturn. So far, they have been proven wrong with both the stock and bond markets having a banner year. Make no mistake about it, trading and forecasts get prime attention but do not always translate into the best results. Sticking with a long-term investment plan is the surest way to achieve your goals. Just last year we saw how quickly we can experience a market pullback. From the end of August (8/29/18) through Christmas Eve (12/24/18), the US market (S&P 500) fell 18%. However, since that time it has rallied back 38% through 12/16/2019. Short-term volatility is part of investing and therefore is the cost of achieving a higher long-term rate of return.
I recently read a book “Simple Wealth, Inevitable Wealth” by Nick Murray. It is a really great read and it inspired me to clearly share with you the risks of investing. My desire is to explain the three risks to give you more confidence around investing in all types of market environments.
Business Risk
Investopedia defines business risk as “anything that threatens a company’s ability to meet its target or achieve its financial goals.” A classic example of business risk is the fall of Enron in the early 2000s. In August of 2000, Enron was the 7th largest publicly traded company. On December 2, 2001, Enron declared bankruptcy. Enron failed because of fraudulent accounting and business practices.
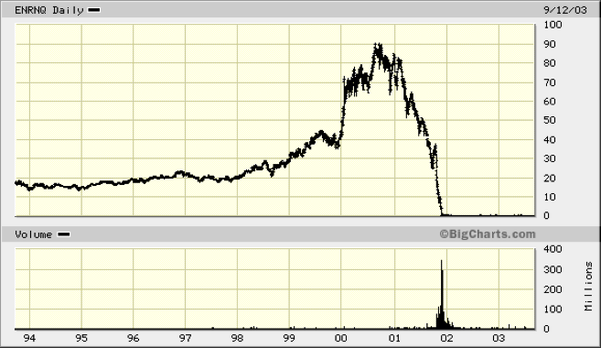
It has been said that the only free lunch in investing is diversification. By not owning too much of one particular stock you spread your risk over many companies. A globally diversified portfolio will contain thousands of stocks to avoid business risk that can lead to catastrophic investment mistakes. Diversification can be accomplished with a small number of mutual funds and exchange-traded funds that own thousands of stocks and/or bonds.
Market Risk
Also called systematic risk, market risk is the risk of investor loss in the overall financial markets. It can be mitigated but not avoided through diversification. Factors such as recessions, political uncertainty and natural disasters affect overall market risk. This is the risk that is most familiar to us all. It is discussed in the news constantly. There is a continuous thrill of uncertainty associated. All you have to do is turn on CNBC to see it.
During the financial crisis of 2008, we experienced a selloff in the global financial markets. However, the crisis began with borrowers defaulting on loans that they never should have been granted. Therefore, the banking sector was hit especially hard. The overall US market suffered along with banks, but it recovered and continued higher over the last decade. Today, many banks’ stock price is still only 40-60% of their all-time highs reached in 2006 and 2007. The lesson is to diversify not only across businesses but all sectors of the economy. Regulation can change an industry at any point in time.
Historically, the US market has been positive 88% of the time over a rolling 5-year period. See the chart below. Based on history, you could argue that the loss of capital related to market risk has been temporary for those who stayed invested.
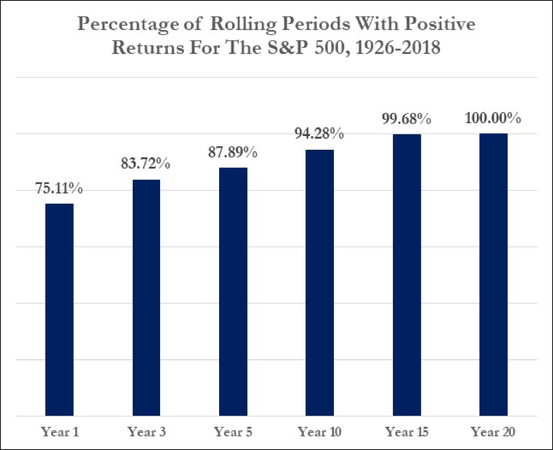
*Past performance is no guarantee of future results.
Inflation Risk
Also called purchasing power risk, inflation risk is the risk that the rise in the cost of goods and services will outpace your investment return. This is the most overlooked risk of the three. Real returns are investment returns minus inflation. In order to sustain or grow wealth, you must achieve a positive real return. Let’s take a look at the historical returns and real returns of stocks, bonds and cash in the chart below.
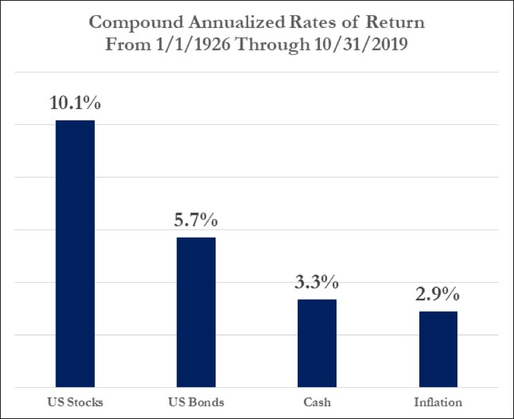
*Past performance is no guarantee of future results. US Stocks (S&P 500), US Bonds (Long-term Government Bonds), Cash (One-Month US Treasury Bills), Inflation (US Consumer Price Index). Sources: Standard & Poors Index Services Group, Morningstar, and Bureau of Labor Statistics.
As you will see, stocks are the only asset class that provide you with substantial real returns (10.1% -2.9% inflation =7.2% real return). Bonds provide some real return but cash does not. Inflation has been low the past decade and is around 2% today vs. 3% long-term average. Inflation risk must be taken into account when determining your investments.
The Big Picture
All three of these risks are why diversification and asset allocation are so important throughout your career and on through retirement. We can avoid material business risk through diversification. We embrace market risk in order to achieve investment return. We recognize inflation risk as a substantial threat to building long-term wealth and, therefore, consider it in determining an overall asset allocation of stocks, bonds, and cash.
Understanding the risks involved with investing helps us gain perspective on why we focus on the long-term. It also helps us put more focus on the things we can control such as asset allocation, saving and spending. Our advice is to not get caught up in the short-term noise. The chart below shows that just because we have reached new all-time highs does not mean a downturn is imminent. In fact, average annualized returns in the US market have been historically higher one, three and five years later. Enjoy the great year and stay focused on the big picture.
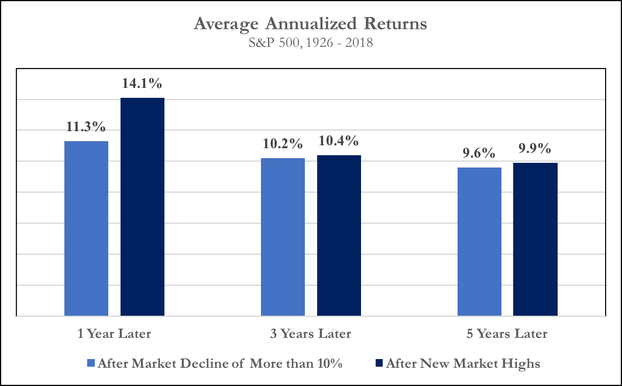
*Source: Dimensional Fund Advisors. In US Dollars. Past performance is no guarantee of future results. Declines are defined as months ending with the market below the previous market high by at least 10%. Annualized compound returns are computed for the relevant time periods after each decline observed and averaged across all declines for the cutoff. There were 1,115 observation months in the sample. January 1990–Present: S&P 500 Total Returns Index. S&P data © 2019 S&P Dow Jones Indices LLC, a division of S&P Global. All rights reserved. January 1926-December 1989; S&P 500 Total Return Index, Stocks, Bonds, Bills and Inflation Yearbook™, Ibbotson Associates, Chicago. New market highs are defined as months ending with the market above all previous levels for the sample period. Annualized compound returns are computed for the relevant time periods subsequent to new market highs and averaged across all new market high observations. There were 1,115 observation months in the sample. January 1990–Present: S&P 500 Total Returns Index. S&P data © 2019 S&P Dow Jones Indices LLC, a division of S&P Global. All rights reserved. January 1926–December 1989; S&P 500 Total Return Index, Stocks, Bonds, Bills and Inflation Yearbook™, Ibbotson Associates, Chicago. For illustrative purposes only. Index is not available for direct investment; therefore, its performance does not reflect the expenses associated with the management of an actual portfolio. There is always a risk that an investor may lose money.
If you would like to discuss or learn more, schedule a call or meeting with me using the link below:

Tripp Yates, CPA/PFS, CFP®
901.413.8659 [email protected]
Tripp’s passion for financial planning is evident to each and every client he meets with. His desire is to help his clients organize their finances, reduce taxes, and invest wisely. As a fee-only fiduciary advisor, Tripp strives to work in a humble and transparent way.
With extensive experience in financial planning and investment management, Tripp diligently uses his credentials of CPA and CFP® to benefit his clients. Over the last ten years, he has managed over $100 million in assets for individuals and families. In 2017, he founded Eaglestrong Financial, specializing in helping dentists and business owners. Outside of work, Tripp enjoys running, spending time with his family, and cheering on his favorite sports teams. He is an active member of Harvest Church.
References
https://twitter.com/charliebilello/status/1205269138463215623
https://www.imf.org/en/Publications/WEO
Murray, Nick. Simple Wealth, Inevitable Wealth (6th edition). The Nick Murray Company, Inc. April 2019.
https://www.begintoinvest.com/enron-stock-chart/
Disclaimer
Eaglestrong Financial, LLC is a Registered Investment Advisor offering advisory services in the states of TN and MS and in other jurisdictions where exempted. The information contained herein is not intended to be used as a guide to investing or tax advice. This material presented is provided for educational purposes only and should not be construed as investment advice or an offer or solicitation to buy or sell securities. Past performance is no guarantee of future results.
#eaglestrong #eaglestrongfinancial
Share with others: