

A Look Back
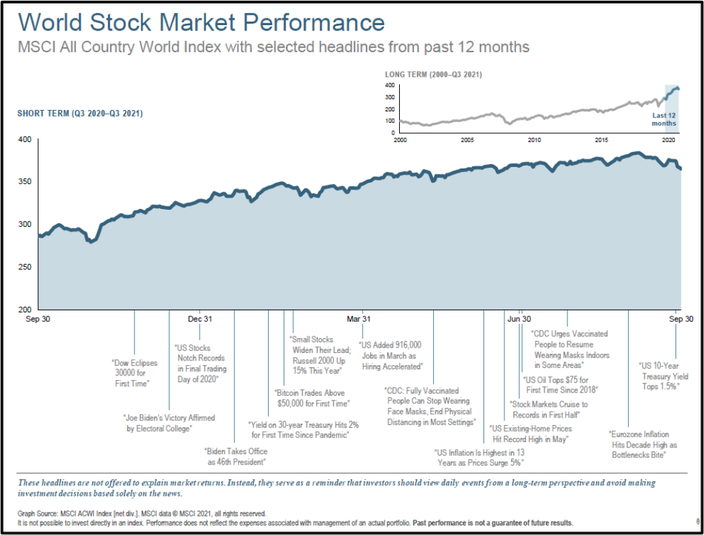
For the 3rd quarter1, stocks retreated and took a break from record highs: (-0.1%) US, (-4.4%) US small companies, (-0.7%) International Developed, and (-8.1%) Emerging Markets. The US total bond market rose slightly (+0.1%).
Volatility Returns
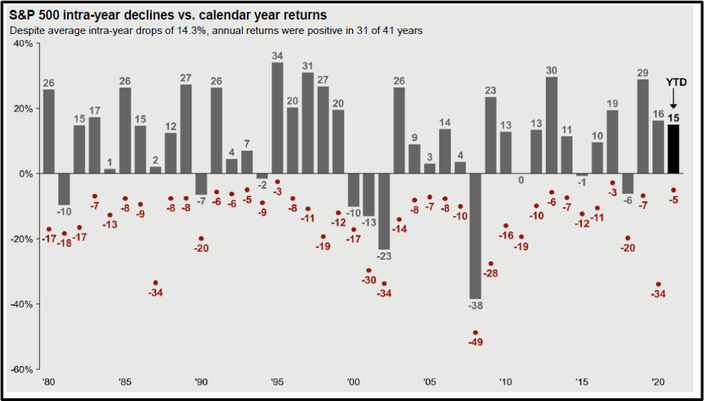
While volatility has recently returned to the US stock market (S&P 500), the market strength has been robust year-to-date through the end of the 3rd quarter (+15%) even after a 5% pullback in the month of September. I’ve often said a good analogy of the market is 5 steps forward and 2 steps back. We have been accustomed to lower volatility in the market and sustained upside coming out of the COVID selloff in March 2020. Much of this calm in the market has been attributed to government stimulus, low interest rates, and pent-up consumer demand. When looking at the facts in the chart below, we see that over the last 41 years, the US stock market (S&P 500) has an average intra-year drop of 14.3% from top to bottom. Occasional pullbacks every year are to be expected. Even still, annual returns were positive 31 out of 41 years.
Looking Ahead: Inflation and Investing
As we approach the final quarter of 2021, one of the biggest questions is will higher inflation of 5% (Consumer Price Index) that we have seen over the last year continue? Or, is it just a temporary side-effect of COVID lockdowns in the supply chain that will self-correct over the next year? Over the last decade, annual inflation has been around 2%, so the increase over the past year has been noticeable whether at the grocery store or the gas pump. You can clearly see the effects on the supply chain by looking at the lots of car dealerships today. Most are nowhere near full of cars like in normal times. In September, US savings deposits at commercial banks stood around $9 trillion. There is still plenty of cash to spend or invest if the supply chain can catch up to the demand. With the 10-year treasury bond interest rate hovering around 1.5%, investors will be required to invest in stocks, real estate or businesses to achieve an investment return to offset higher inflation whether short-term or sustained for a longer period.
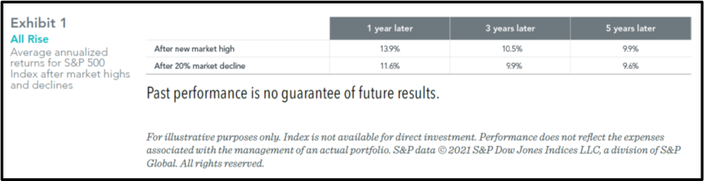
We have had many record highs in the US stock market year-to-date. Human nature and constant news headlines cause us to feel that a drop in the market is imminent once a record high is reached. The recent 5% pullback in September fits nicely with that narrative. However, looking at the facts, historical returns from stocks remain around their annual average of 10% 5 years later whether a record high is reached or a 20% decline has transpired. This reminds us to tune out the noise of headlines today that will become footnotes tomorrow. Financial planning accounts for and expects volatility in the short-term to achieve our desired expected investment rates of return to meet our goals.
If you would like to discuss or learn more, schedule a call or meeting with me using the link below:

Tripp Yates, CPA/PFS, CFP®
901.413.8659 tripp@eaglestrong.com
Tripp’s passion for financial planning is evident to each and every client he meets with. His desire is to help his clients organize their finances, reduce taxes, and invest wisely. As a fee-only fiduciary advisor, Tripp strives to work in a humble and transparent way.
With extensive experience in financial planning and investment management, Tripp diligently uses his credentials of CPA and CFP® to benefit his clients. Over the last ten years, he has managed over $100 million in assets for individuals and families. In 2017, he founded Eaglestrong Financial, specializing in helping dentists and business owners. Outside of work, Tripp enjoys running, spending time with his family, and cheering on his favorite sports teams. He is an active member of Harvest Church.
References
1 3rd quarter 2021 stock and bond market returns: US – Russell 3000 Index, US small companies – Russell 2000, International Developed – MSCI World ex US, Emerging Markets – MSCI Emerging Markets, US total bond market – Barclays US Aggregate Bond Index
J.P. Morgan Asset Management Guide to the Markets 4Q 2020 – U.S. Data are as of September 30, 2021.
https://www.dimensional.com/us-en/insights/2021-hot-topics-inflation-crypto-and-market-highs
https://twitter.com/awealthofcs/status/1436348438526976014?s=20
Vanguard. Best, worst, and average annual returns for various bond/stock allocations, 1926-2020
https://www.dimensional.com/us-en/insights/all-time-high-anxiety
Disclaimer
Eaglestrong Financial, LLC is a Registered Investment Advisor offering advisory services in the states of TN and MS and in other jurisdictions where exempted. The information contained herein is not intended to be used as a guide to investing or tax advice. This material presented is provided for educational purposes only and should not be construed as investment advice or an offer or solicitation to buy or sell securities. Past performance is no guarantee of future results.
#eaglestrong #eaglestrongfinancial
Share with others: